Reporting and Management

All the data from your buildings
presented in truly insightful dashboards.

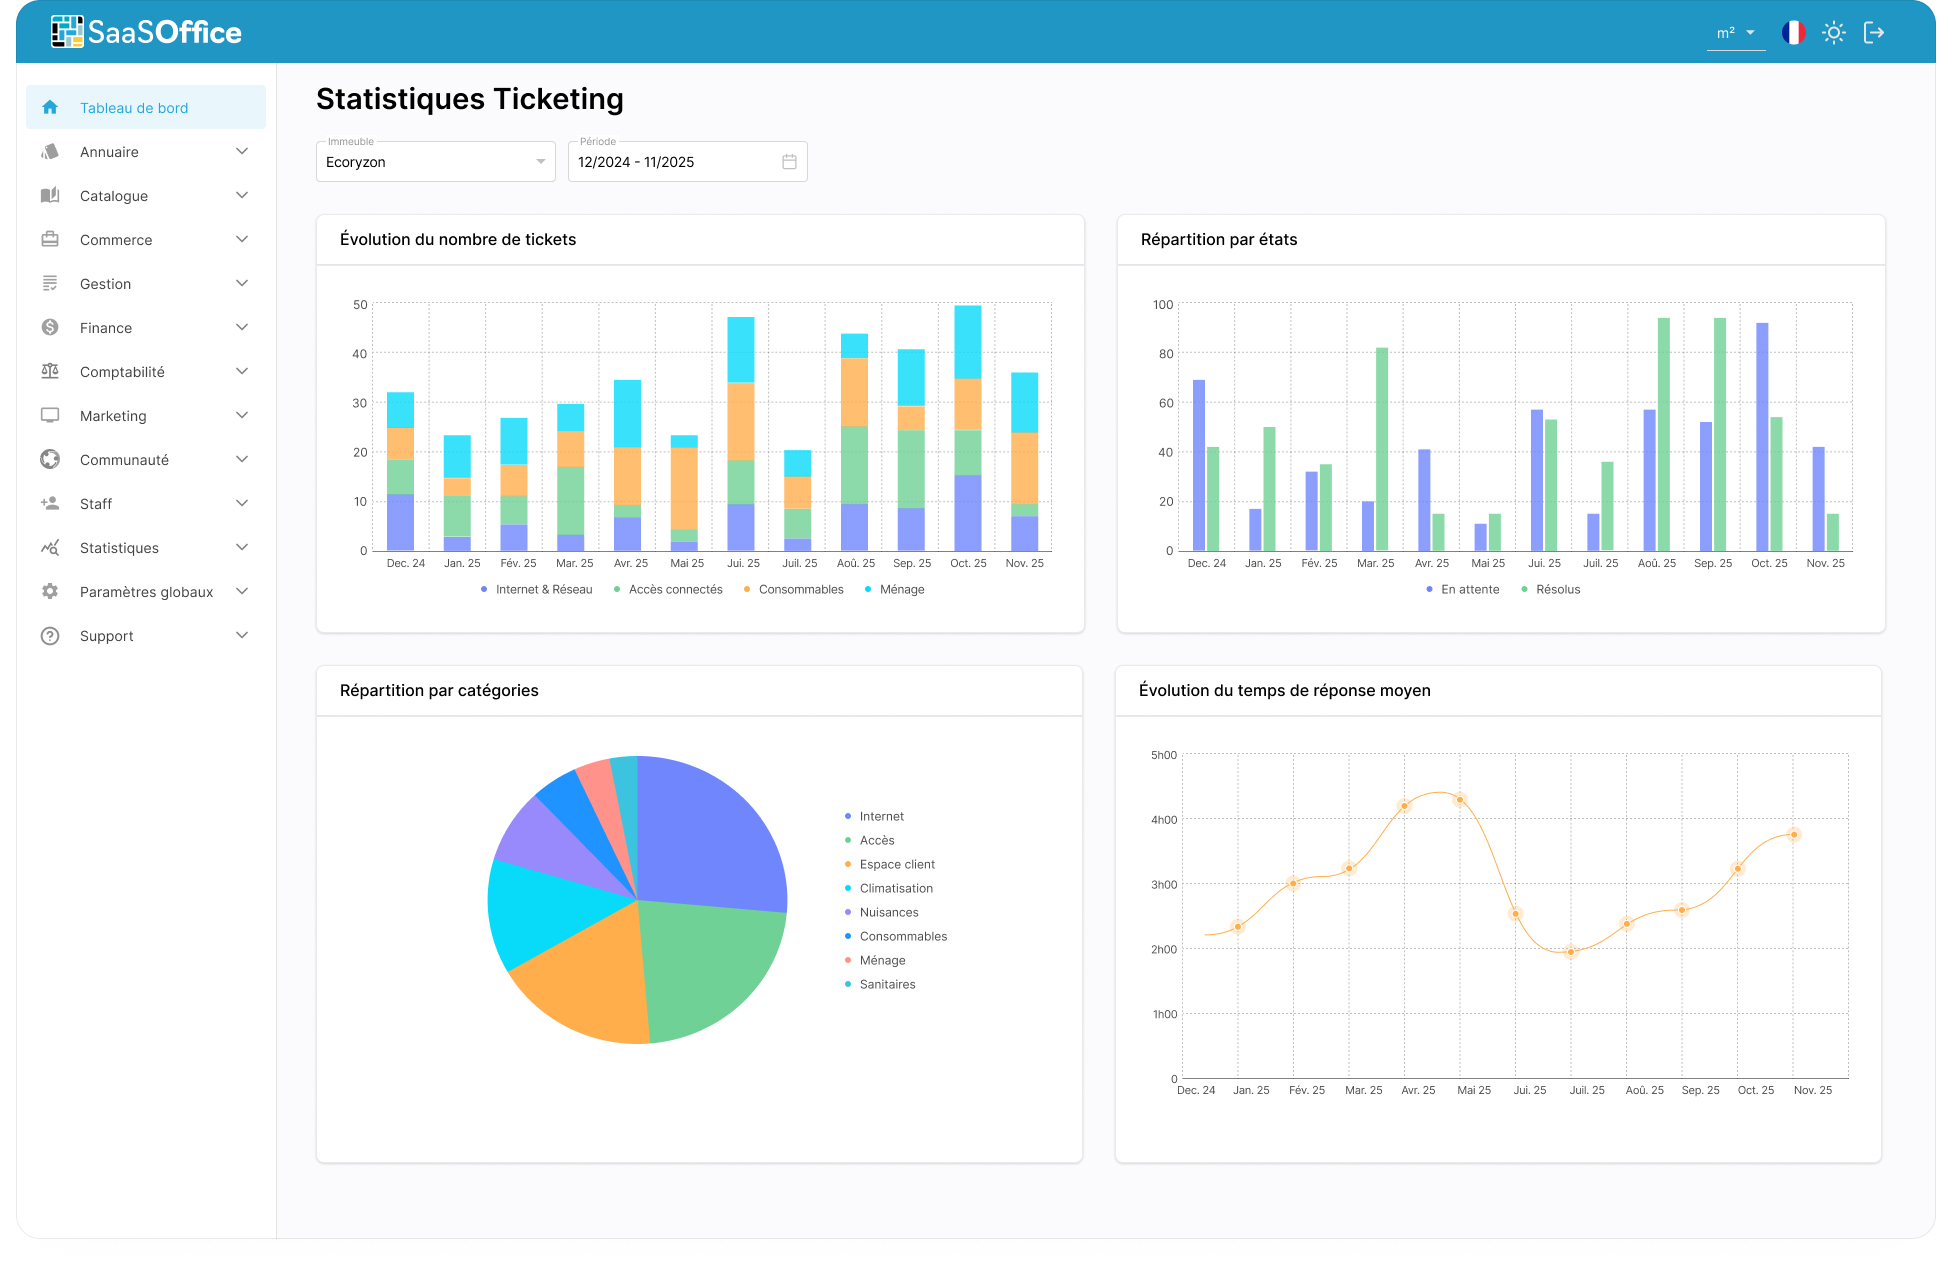
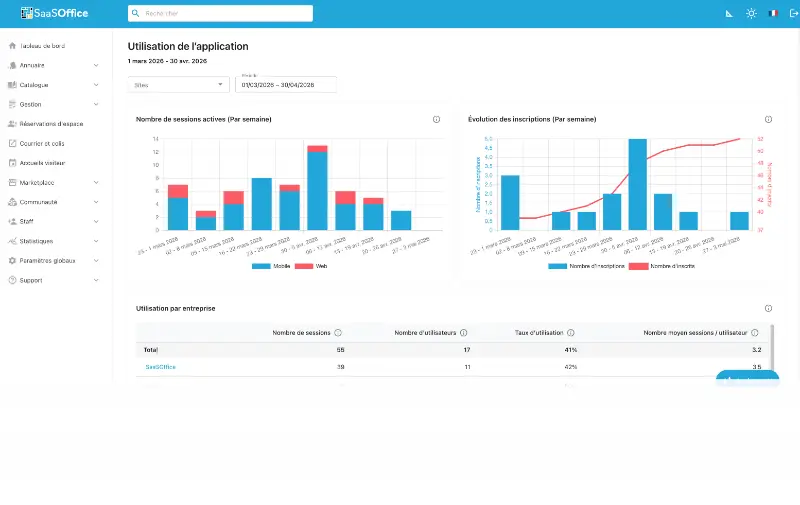
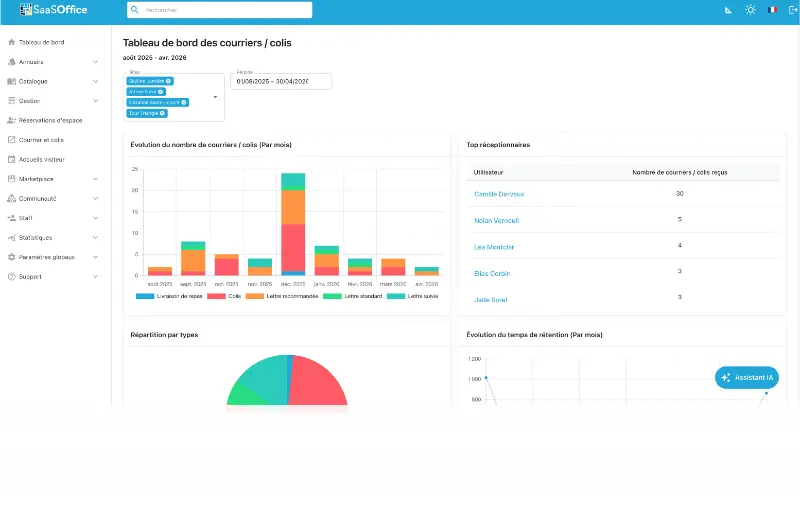
SaaSOffice Reporting Console, Incident Volume by Site with NOVA Tooltip
Administrator View, the Reporting Console

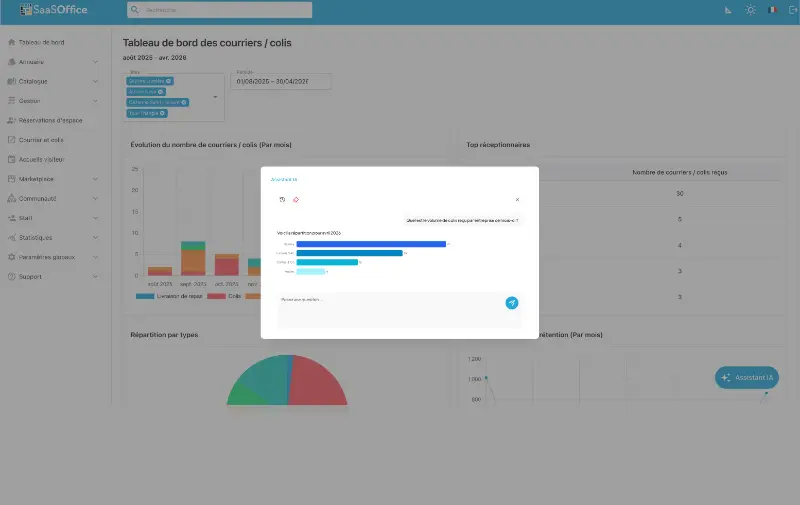
NOVA answers your decision-makers' questions in natural language and brings your charts to life.

  1. 01 Step 1

    Five operational dashboards, one for each area.

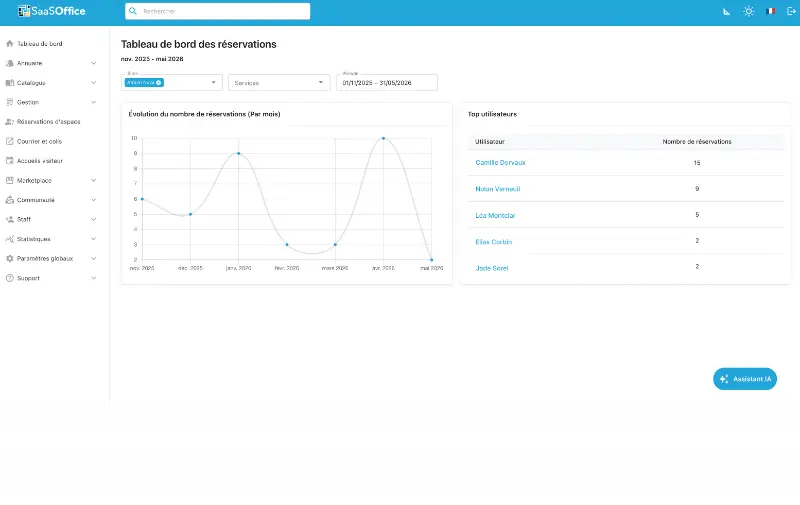
    Incidents, access, reservations, visitors, services. Each area has its own customizable dashboard, with daily, weekly, and monthly views, and filters by site, floor, or division. Your managers can run their operations without having to juggle 12 different tools.

  2. 02 Step 2

    Consolidated multi-site view, real-time comparison.

    Roll-up reports across all your locations, cross-location comparisons (Paris vs. Lyon vs. Bordeaux), identification of the most active locations, and internal benchmarks. A single interface—no more Excel exports per location that you have to merge manually.

  3. 03 Step 3

    Indicators of service and space usage.

    Reservation rates by room, occupancy rates by flexible office, most-used services, underutilized services. NOVA identifies spaces and services that are causing frustration (overused) as well as those that are underutilized (to be addressed).

  4. 04 Step 4

    Projections and anomalies reported by NOVA.

    NOVA anticipates peaks before they occur, including cafeteria capacity, visitor reception lines, and CMMS workload. The week’s major issues are escalated to the “to be resolved today” queue, sorted by severity. Proactive management, not reactive.

  5. 05 Step 5

    Export and integration with your BI tools.

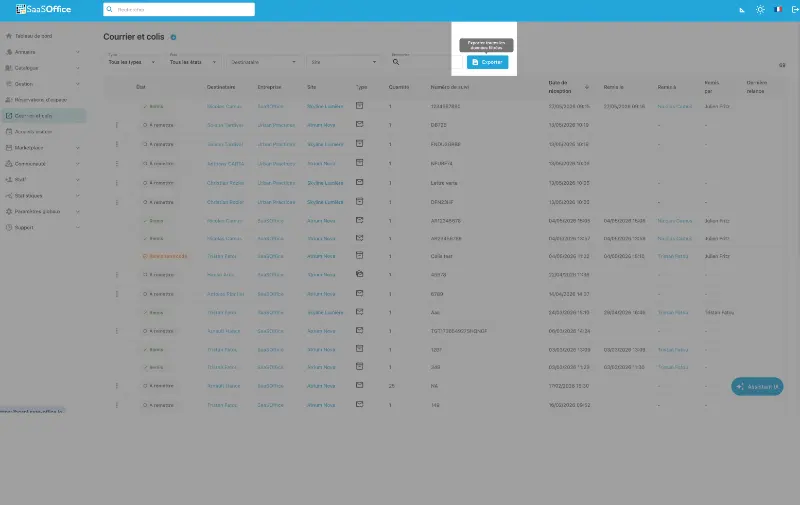
    Power BI, Tableau, Looker, or raw CSV export. Your data remains yours, in an open format, with a scope that can be customized by each user. For organizations that have already invested in a BI stack, SaaSOffice integrates with it without replacing it.
WITH OR WITHOUT NOVA

The difference is evident from the very first call.

Five mirrored lines. What your decision-makers are going through today—what they’ll love tomorrow.

WITH NOVA The experience your managers love
WITHOUT NOVA The experience they are going through
Consolidation
All interactions (visitors, incidents, access, services) in a single console.
One export per tool, per site, per month, followed by manual data entry into Excel.
Freshness
Real-time data, live dashboards, up-to-the-minute metrics.
Monthly reporting; data that was already outdated at the time of the decision.
Multi-site
Native roll-up, cross-site comparison, internal benchmarks.
Viewed site by site, manual comparisons, no automatic roll-up.
Anticipation
NOVA projections, anticipated peaks, and reported anomalies for the week.
Reactive management: we don't discover the problem until it's already there.
BI Export
Power BI, Tableau, Looker, CSV—your data remains yours.
No clean export, separate BI stack, duplicates, and inconsistencies.
REPORTING FAQ

Your Questions About Reporting and Management

What metrics are available upon deployment?
All SaaSOffice modules generate their metrics natively, with no initial configuration required. Incidents (volume, MTTR, resolution NPS, service provider quality), access (openings by area, top users, alerts), reservations (occupancy rate, no-shows, average duration), visitors (volume, reception NPS, wait time), services (usage rate, top services, satisfaction). The dashboards are ready to use and can be customized to suit your business needs.
How do you manage multi-site setups? Automatic roll-up or manual configuration?
Native roll-up. As soon as multiple sites are registered, the reporting console automatically aggregates the data, providing both a consolidated view and a site-by-site view—both available with a single tap. Cross-site comparisons, internal benchmarks, and identification of the most active or underperforming sites. For multi-zone groups (region, country, BU), custom groupings can be configured while maintaining access rights by group.
How does BI export work? Do we retain control over our data?
Your data belongs to you—open format. Three export modes: native connectors for Power BI, Tableau, and Looker (with automatic daily refreshes); a REST API for your own pipelines; and manual or scheduled CSV/Parquet exports. The scope of exported data is customizable per user (a facility manager doesn’t export the same data as an executive). No vendor lock-in—you can leave SaaSOffice with your complete historical data.
GET STARTED

See your actual numbers in our dashboards.

30 minutes. We connect a sample of your data to the sandbox, and NOVA analyzes your data trends based on the topics you provide at the start of the call.